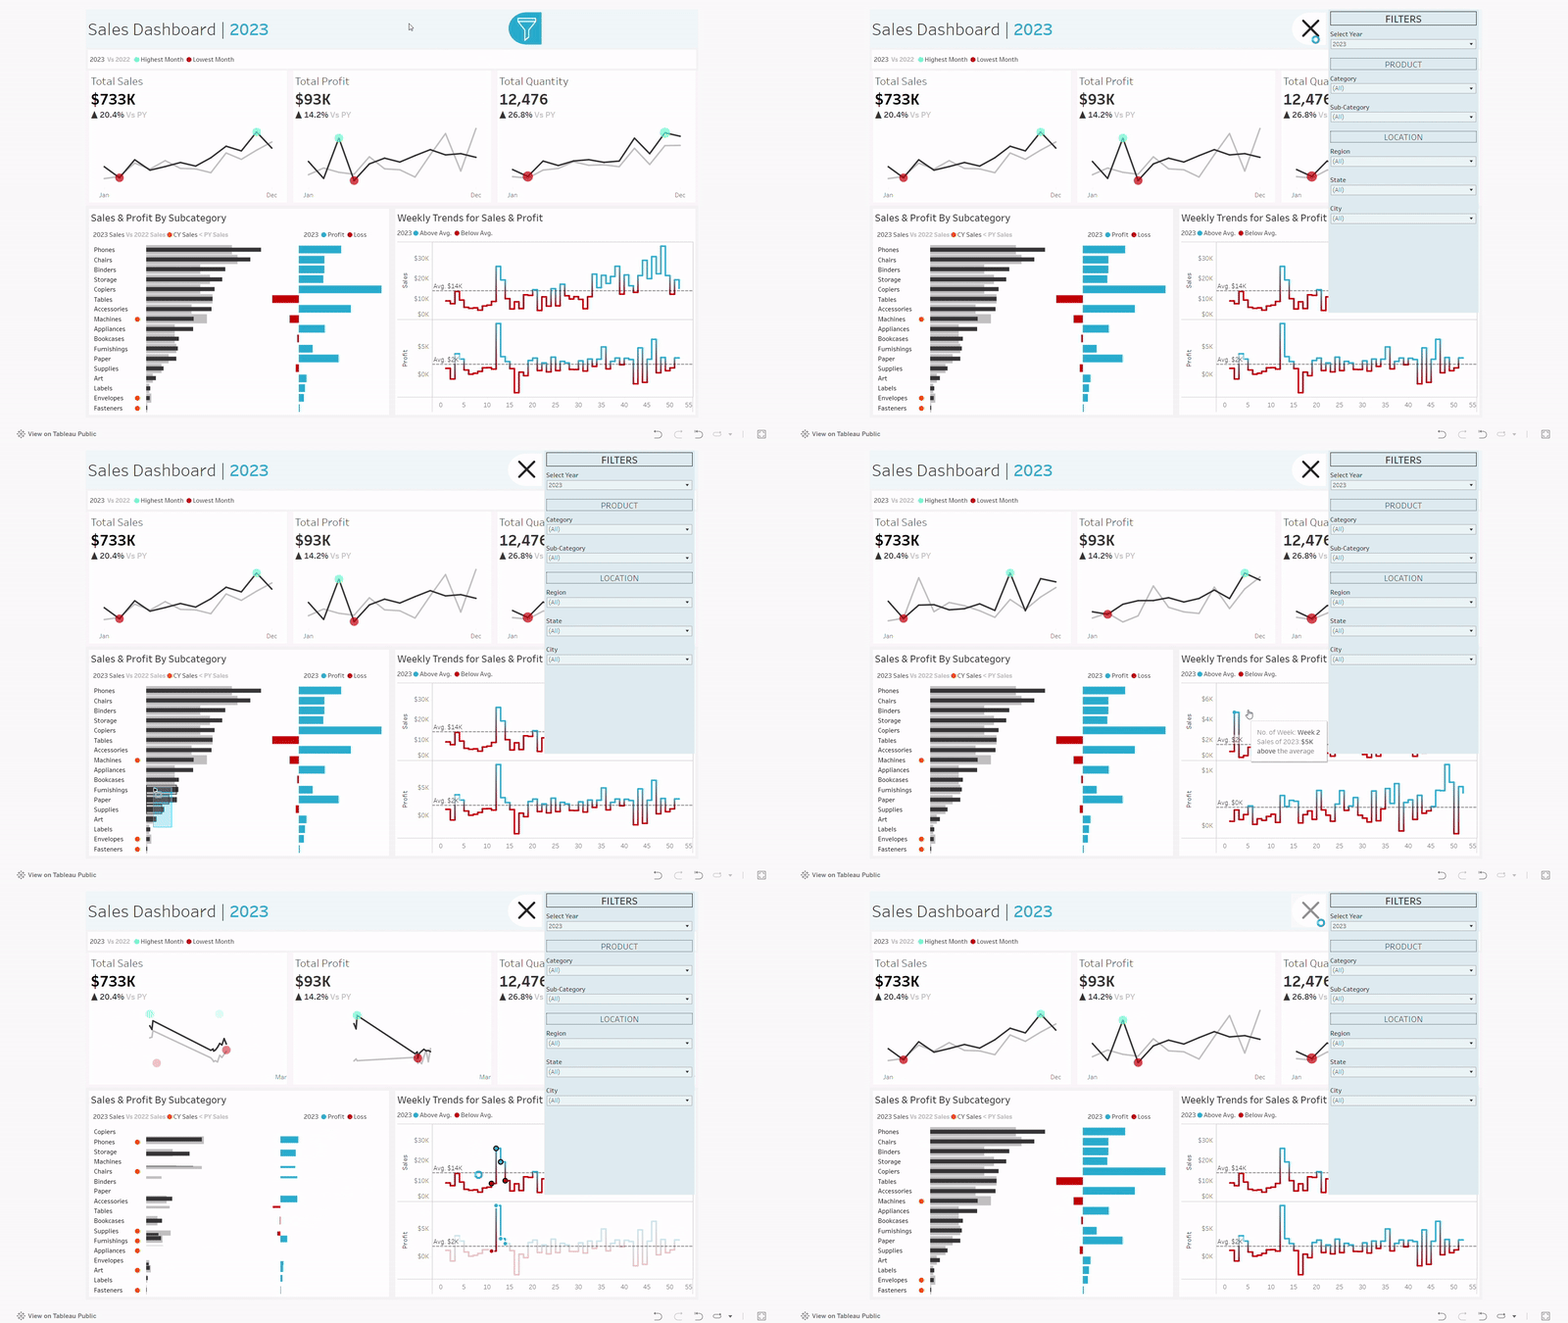
Sales dashboard using Tableau
In this project, we will build a dashboard using Tableau to help stakeholders analyze sales performance for the years 2020-2023. The dashboard is designed based on the following requirements, and the complete dashboard can be accessed at the following link:
Click here to view the full dashboard
1 Dashboard Requirements
Sales metrics and trends:
Display a summary of sales metrics such as total sales, total profits, and total quantity, comparing the current year with the previous year with KPI symbol.
For each sales metric, present the data on a monthly basis, comparing the current year with the previous year. Highlight the highest and lowest months.
Product subcategory comparison:
Compare sales across different product subcategories for the current year and the previous year.
Compare sales and profits for the current year.
Weekly trends for sales & profit:
Present weekly sales and profit data for the current year.
Display the average weekly values for sales and profit data.
Highlight weeks that are above and below the average values to draw attention.
2 Design & Interactivity Requirements
Make the graphs interactive, enabling the users to filter the data using graphs.
The dashboard should allow users to check historical data by offering them the flexibility to select any desired year.
Allow users to filter the data by product information like category and subcategory, as well as by location information such as region, state, and city.
3 Sample GIF of the Dashboard
